Afsnit 5.6: Regression med kendt skæring
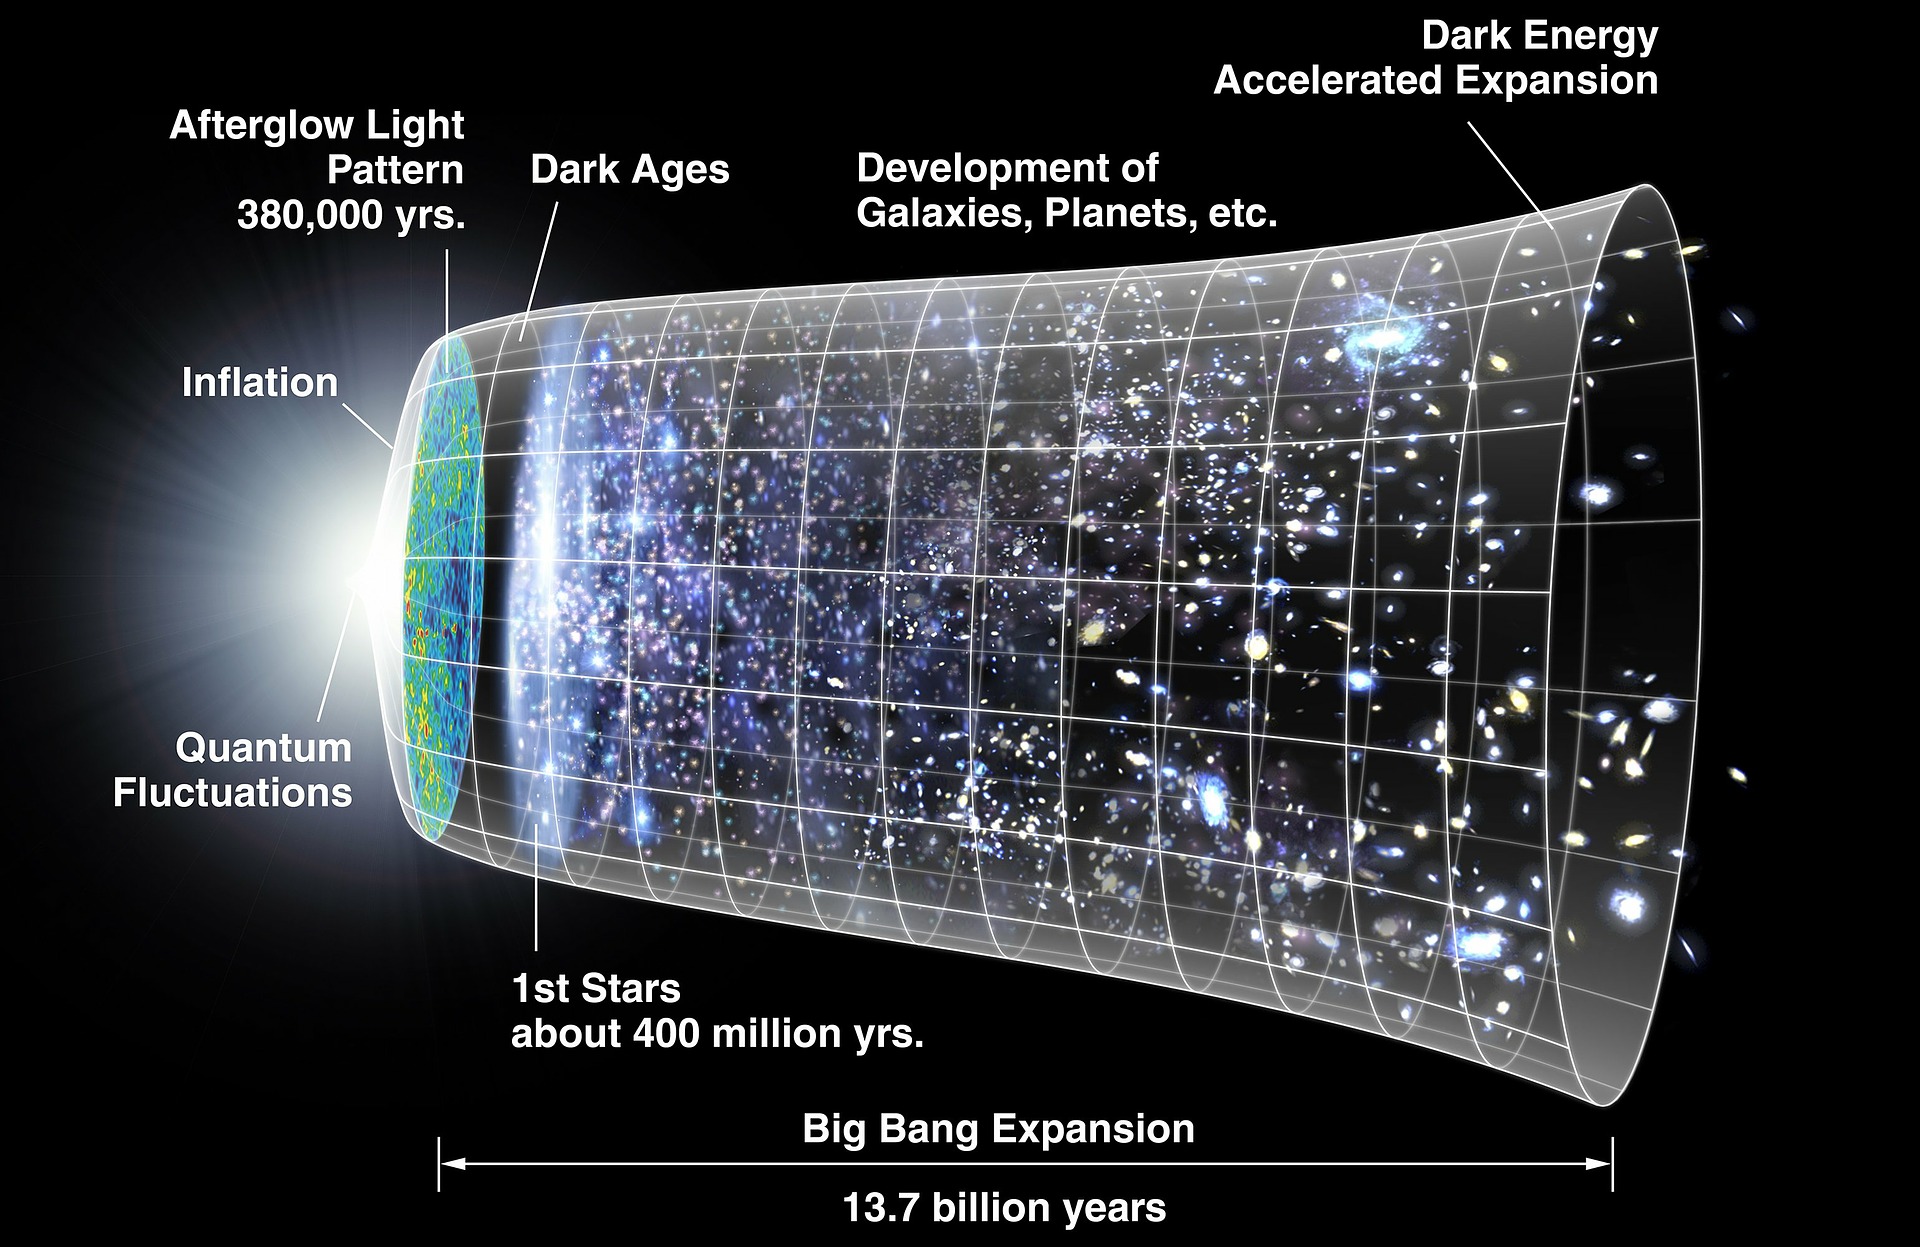
Hubbles lov
siger, at den hastighed, hvormed galakser bevæger sig væk
fra hinanden, er proportional med afstanden mellem galakserne.
Formuleringen af loven af Edwin Hubble i 1929 er baseret på data
indsamlet over en 10-års periode og vist i kodevinduet nedenfor.
Loven danner baggrund for teorien om det ekspanderende univers.
Data består af værdierne
for
24 galakser (afstand måles i megaparsecs og hastighed
i kilometer per sekund). Som statistisk model bruger vi
(Statistisk Model
5.1.2)
I kodevinduet analyseres denne model.
Analyse og figur
Når du kører ovenstående kode, vil du se, at
-værdien for et
test af hypotesen
er 0.630.
Data strider altså ikke mod denne hypotese, som netop siger, at
der er proportionalitet mellem afstand og (middelværdi af) hastighed.
Fra output ses også, at et 95%-konfidensinterval for
hældningen
er
Intervallet er meget bredt, hvilket afspejler,
at der er stor variation i data omkring den lineære sammenhæng.
Modellen, der udtrykker proportionalitet, kan udtrykkes generelt som
Analysen af denne model i Python foretages som før med
funktionen
ols.
For at fortælle at skæringen er nul, skal
man tilføje "-1" i modelformlen, således at denne bliver
'xt-1'.
For Hubbles data er dette vist i det kommende kodevindue, hvor den røde
linje i figuren er den estimerede linje i tilfældet med
.
5.6.1 Analyse af regressionsmodel med kendt skæring
I regressionsmodellen, hvor vi har antaget proportionalitet,
altså at skæringen er nul,
viser
output, at konfidensintervallet for
hældningen
er
Vi kan se, at
konfidensintervallet bliver noget smallere
sammenlignet med konfidensintervallet fra modellen, hvor
er en ukendt parameter. Dette er et generelt fænomen: hvis
man kan reducere en model ved at sætte nogle parametre til nul, vil
de resterende parametre blive bedre bestemt. En del af den
statistiske analyse går netop ud på at reducere en model for
både at få en mere simpel model og for at få de resterende
parametre bedre bestemt.
Intervallet for hældningen
(= proportionalitetskonstanten = Hubbles konstant) er stadig
stort og, som det har vist sig, fejlvisende. Den
anerkendte værdi
i dag
ligger omkring 70. Et af problemerne med Hubbles data er, at strukturen
af nogle af de stjerner, der blev brugt, blev fejltolket på daværende tidspunkt.
Ovenfor har vi betragtet delmodellen af modellen
hvor
er kendt og lig med nul.
Mere generelt kan vi se på situationen, hvor
er kendt og lig med
Denne model kan analyseres
ved at betragte
og benytte resultaterne
for situationen med
5.6.1 Fordelingsresultater
I modellen
er
og skønnet over variansen
er
Ud fra disse resultater kan vi lave en
-teststørrelse for test
af værdien af hældningen
og lave et 95%-konfidensinterval.
Det sidstnævnte er på formen
ForegåendeNæste